Designed · Kingston, Jamaica · v0.9

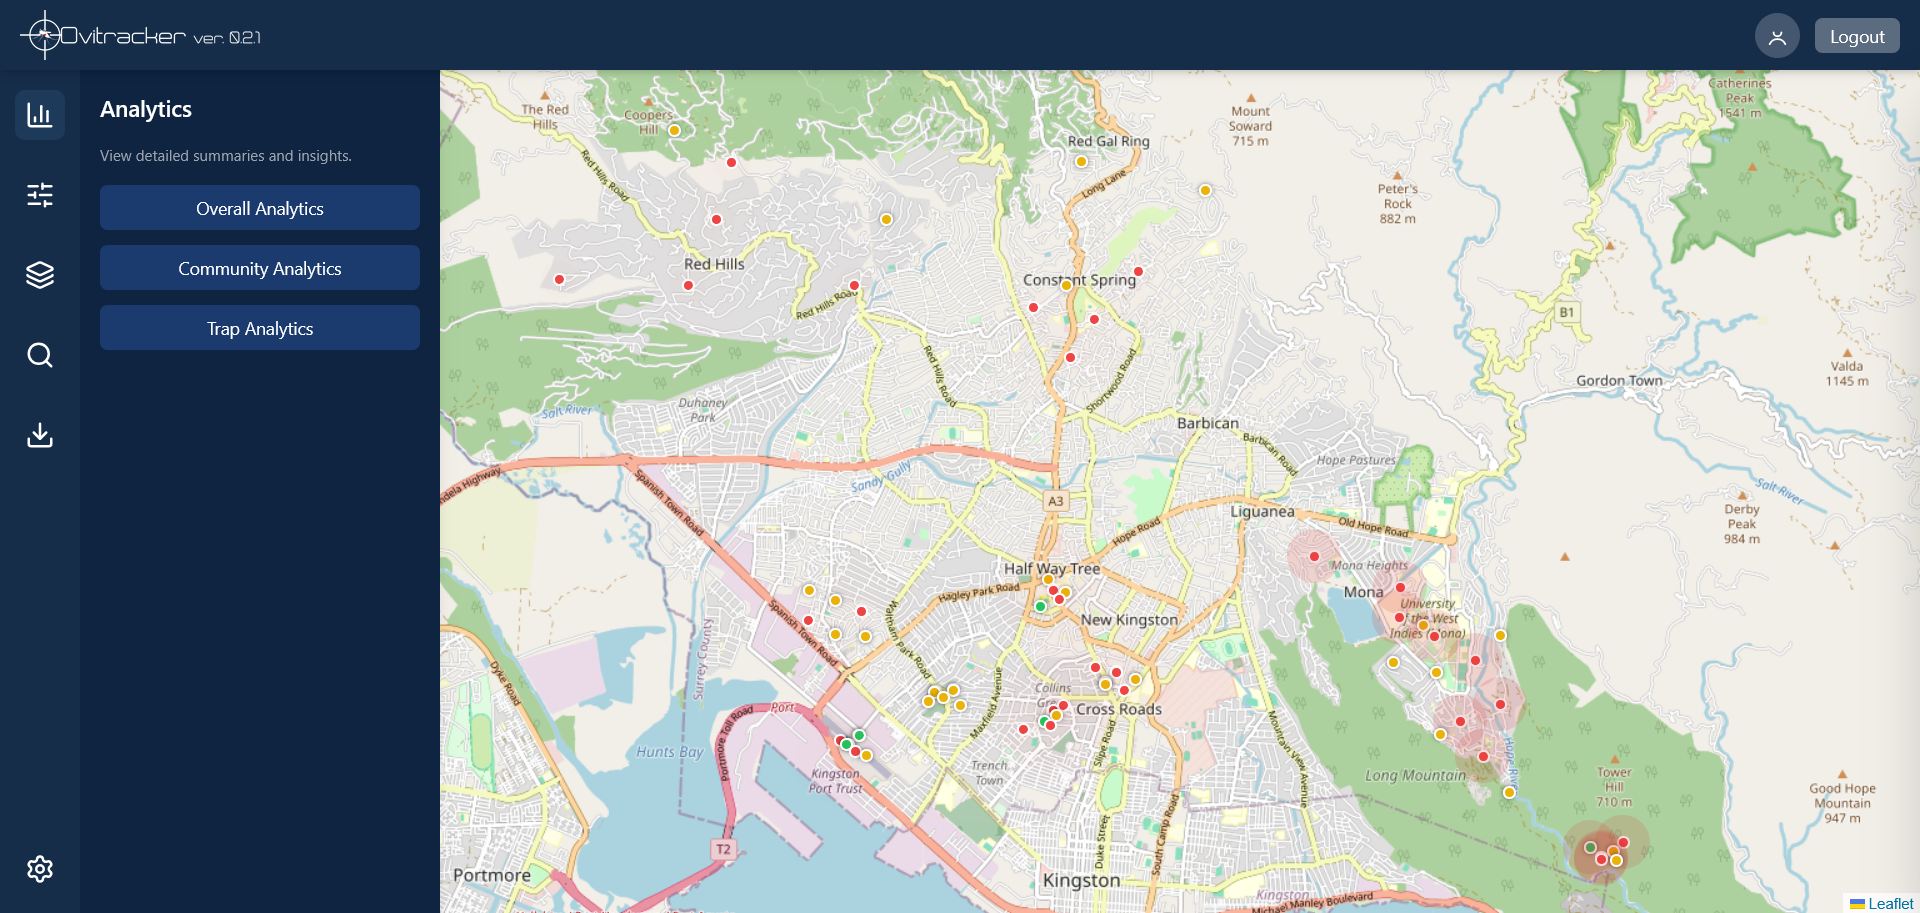
Mosquito surveillance that thinks spatially

Ovitracker transforms ovitrap field readings into community-level dengue risk intelligence — on a live map, in real time, with an original algorithmic risk score designed for vector control operations.

www.ovitracker.com.jm/demo
Ovitracker dashboard — analytics panel and live community map
7
BRS input factors
4
Risk tiers (Low → Critical)
24+
API endpoints
Prototype
Kingston & St. Andrew, Jamaica
Original methodology
The Bennett Risk Score

A proprietary risk-scoring algorithm developed from operational surveillance experience in Jamaica. The BRS converts raw ovitrap field data into a single 0–100 community risk index — spatially weighted, temporally adjusted, and calibrated against PAHO/Caribbean standards.

The score is computed from seven weighted surveillance factors drawn from ovitrap field data, spatial trap coverage, inspection timing, historical trends, and site sensitivity. Two additional multipliers adjust for placement context and statistical confidence.

The result is a single, actionable number — updated in real time each time a field reading is submitted — that programme managers can act on without needing to interpret raw egg counts themselves.

Patent pending. The Bennett Risk Score methodology is the subject of provisional patent applications filed in Jamaica and the United States. Full technical documentation is available to verified research and institutional partners under a confidentiality agreement.

Low
0–24
Routine surveillance
Medium
25–49
Heightened monitoring
High
50–74
Targeted intervention
Critical
75–100
Emergency response

Output risk tiers mapped to standard vector control response levels

Platform capabilities
Everything a vector control programme needs

From field officer to programme director — Ovitracker supports the full surveillance workflow on web and Android mobile.

Live geospatial risk map

Community polygons colour-coded by current BRS risk tier update in real time as field readings come in. Programme officers can toggle overlays including wind-offset vector dispersal modelling, egg density heatmap, and satellite imagery.

React-LeafletCommunity polygonsWind dispersalHeatmap
Live community risk map with BRS-tiered polygons

Mobile field data entry

Surveillance officers use the Android tablet app to log trap readings directly in the field. GPS coordinates, egg counts, and inspection dates are submitted with weather data automatically fetched from the trap location — no manual weather logging required.

React NativeAndroid APKGPSOpenWeather
Mobile field app — trap map view

Analytics dashboard

Community-level egg count trends, BRS score history, trap positivity rates, and comparative risk rankings across the surveillance area. Export to CSV or GeoJSON for integration with national GIS platforms.

RechartsTrend analysisCSV exportGeoJSON
Analytics dashboard — risk distribution and egg count trend

Role-based access control

Administrators, programme officers, and field officers each have scoped access. Trap and community assignments control which data each officer can see and submit.

Real-time score recalculation

Every submitted reading triggers immediate BRS recalculation for the affected community. The map updates without manual refresh.

Spatial trap management

Register traps with GPS coordinates, site type classification, and sensitivity rating. Community polygons stored as spatial geometry for precise containment queries.

Weather integration

OpenWeather API data is automatically fetched at each reading submission using the trap's GPS coordinates — temperature, humidity, rainfall, and prevailing wind direction stored per reading.

Audit log & export

All platform actions are timestamped and logged by user. Programme-level reports export to CSV. Community boundaries and BRS scores export to GeoJSON for national GIS integration.

Designed for adaptation

Risk thresholds and weighting coefficients are parameterised for reconfiguration. Community polygon boundaries load from standard GeoJSON. API-first for MoH system integration.

Technology
Built for production

A full-stack platform deployed on cloud infrastructure with a REST API, spatial database, and native Android mobile app.

Frontend
React 18
Tailwind CSS · Recharts · React-Leaflet
Backend
PHP 8.2 REST API
JWT auth · 24+ endpoints · CORS
Database
MySQL 8.0
Spatial extensions · ST_Contains · SRID 4326
Mobile
React Native
Expo · Android APK · WebView Leaflet
Hosting
DigitalOcean VPS
api.devcentral.com.jm
Mapping
OpenStreetMap / Leaflet
OSM · Esri Satellite · CartoDB Dark
Weather
OpenWeather API
Auto-fetched on reading submission
Spatial
QGIS / PostGIS
Polygon pipeline · PostGIS migration planned
Research & partnership
Collaborate on validation and adaptation

The Bennett Risk Score is an original algorithm developed in operational conditions. Its formal validation and adaptation for other country contexts represents a significant research opportunity.

Algorithm validation studies

Retrospective validation against historical dengue case notification data in Jamaica. Prospective field study comparing BRS predictions to outbreak events.

Country adaptation research

Reconfiguration of thresholds and weighting for Caribbean, Latin American, Southeast Asian, and Pacific Island contexts. Full GeoJSON pipeline for new polygon boundaries.

Peer publication

Joint authorship on BRS methodology paper. Platform data and algorithm documentation available under research agreement. Provisional IP protection in place.

Doctoral research framework

Proposed structure: primary supervision through an accredited doctoral programme, with Ovitracker's ongoing field data and platform development forming the basis of the dissertation. Open to co-supervision or partnership with any institution with relevant subject-matter expertise.

Ready to see Ovitracker in action?

Request the full technical brief or reach out to discuss research collaboration, pilot deployment, or country adaptation.

Get the full brief →